
- Communication Ability-6
- Communication Ability-5
- Communication Ability-4
- Communication Ability-3
- Communication Ability-2
- Communication Ability-1
- Statistical Ability-1
- Algebraic and Geometrical Ability-3
- Algebraic and Geometrical Ability-2
- Algebraic and Geometrical Ability-1
- Date and Time Arrangement Problems-2
- Date and Time Arrangement Problems-1
- Coding and Decoding-2
- Coding and Decoding-1
- Series-2
- Series-1
- Odd Things Out-2
- Odd Things Out-1
- Analogy-2
- Arithmetic Ability-3
- Arithmetic Ability-2
- Data Analysis-2
- Data Sufficiency-3
- Data Sufficiency-2
- Analogy-1
- Arithmetic Ability-1
- Data Analysis-1
- Data Sufficiency-1
Question: 6
The following pie-chart shows the number of students studying different courses A, B, C, D, E and F in a college.
ఈ క్రింది పీ చిత్రం, ఒకానొక కళాశాలలో A, B, C, D, E, F అనే కోర్సులను చదివే విద్యార్థుల సంఖ్యను సూచిస్తుంది.

If the total strength of the college is 7200, then the number of students studying course Cis
ఆ కళాశాలలోని మొత్తం విద్యార్ధుల సంఖ్య 7200 అయినపుడు, కోర్సు C ని చదివే విద్యార్థుల సంఖ్య
720
1280
600
1080
Answer: 1
720
Question: 7
The following pie-chart shows the number of students studying different courses A, B, C, D, E and F in a college.
ఈ క్రింది పీ చిత్రం, ఒకానొక కళాశాలలో A, B, C, D, E, F అనే కోర్సులను చదివే విద్యార్థుల సంఖ్యను సూచిస్తుంది.
If the total number of students studying course B is 270, then the number of students studying course D is
B అనే కోర్సును చదివే విద్యార్థుల సంఖ్య 270 అయినపుడు, కోర్సు D ని చదివే విద్యార్ధుల సంఖ్య
180
216
252
268
Answer: 2
216
Question: 8
The following table shows the number of three products P1, P2, P3 sold by five different shops A, B, C, D and E.
ఈ క్రింది పట్టికలో ఐదు దుకాణాలు A, B, C, D మరియు E లచే అమ్మబడిన మూడు ఉత్పత్తులు P1, P2, P3ల సంఖ్యను సూచిస్తుంది.
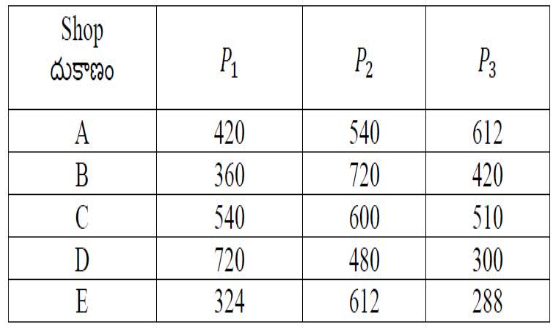
The average of sales of product P3, by all shops A, B, C, D, E is
అన్ని దుకాణాలు A, B, C, D మరియు Eలచే అమ్మబడిన ఉత్పత్తి P3 యొక్క అమ్మకాల సంఖ్యల సగటు
446
436
426
416
Answer: 3
426
Question: 9
The following table shows the number of three products P1, P2, P3 sold by five different shops A, B, C, D and E.
ఈ క్రింది పట్టికలో ఐదు దుకాణాలు A, B, C, D మరియు E లచే అమ్మబడిన మూడు ఉత్పత్తులు P1, P2, P3ల సంఖ్యను సూచిస్తుంది.
The percentage of sales of product P1 in the total sales of shop D is దుకాణము D మొత్తం అమ్మకాలలో ఉత్పత్తి P1 యొక్క అమ్మకాల శాతం
48
20
34
52
Answer: 1
48
Question: 10
The following table shows the number of three products P1, P2, P3 sold by five different shops A, B, C, D and E.
ఈ క్రింది పట్టికలో ఐదు దుకాణాలు A, B, C, D మరియు E లచే అమ్మబడిన మూడు ఉత్పత్తులు P1, P2, P3ల సంఖ్యను సూచిస్తుంది.
What is the ratio between the total number of products sold by shop B and C? B, C అనే దుకాణాలు అమ్మిన మొత్తం ఉత్పత్తుల నిష్పత్తి ఎంత ?
11:10
10:11
9:10
10:9
Answer: 2
10:11