
- Communication Ability-6
- Communication Ability-5
- Communication Ability-4
- Communication Ability-3
- Communication Ability-2
- Communication Ability-1
- Statistical Ability-1
- Algebraic and Geometrical Ability-3
- Algebraic and Geometrical Ability-2
- Algebraic and Geometrical Ability-1
- Date and Time Arrangement Problems-2
- Date and Time Arrangement Problems-1
- Coding and Decoding-2
- Coding and Decoding-1
- Series-2
- Series-1
- Odd Things Out-2
- Odd Things Out-1
- Analogy-2
- Arithmetic Ability-3
- Arithmetic Ability-2
- Data Analysis-2
- Data Sufficiency-3
- Data Sufficiency-2
- Analogy-1
- Arithmetic Ability-1
- Data Analysis-1
- Data Sufficiency-1
Question: 16
The following pie chart shows the percentages of number of students studying five courses Mathematics (M), Humanities (H), Physics (P), Biology(B), Chemistry (C) in a college for the year 2023.
ఈ క్రింది పీ చిత్రం ఒకానొక కళాశాలలో 2023వ సంవత్సరములో ఐదు కోర్సులు గణితం(M), మానవీయ శాస్త్రాలు (H), భౌతిక శాస్త్రం (P), జీవశాస్త్రం (B), రసాయన శాస్త్రం (C) లను చదివే విద్యార్థుల శాతాలను సూచిస్తుంది.
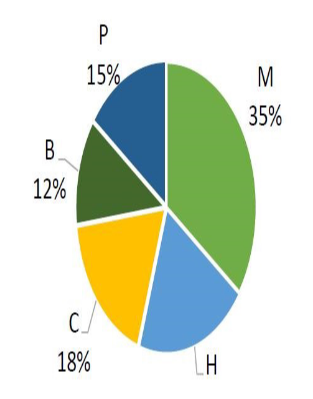
What is the sectorial angle in (degrees) corresponding to the number of students studying Physics in that college?
ఆ కళాశాలలో భౌతిక శాస్త్రాన్ని చదివే విద్యార్ధుల సంఖ్యను సూచించే సెక్టారు కోణం (డిగ్రీలలో)
126
54
72
60
Answer: 2
Question: 17
The following pie chart shows the percentages of number of students studying five courses Mathematics (M), Humanities (H), Physics (P), Biology(B), Chemistry (C) in a college for the year 2023.
ఈ క్రింది పీ చిత్రం ఒకానొక కళాశాలలో 2023వ సంవత్సరములో ఐదు కోర్సులు గణితం(M), మానవీయ శాస్త్రాలు (H), భౌతిక శాస్త్రం (P), జీవశాస్త్రం (B), రసాయన శాస్త్రం (C) లను చదివే విద్యార్థుల శాతాలను సూచిస్తుంది.
If the total number of students of that college is 3800, then how many students are
studying Humanities?
ఆ కాలేజీలో మొత్తం విద్యార్థుల సంఖ్య 3800 అయితే, మానవీయశాస్త్రాన్ని చదువుతున్న
విద్యార్థులు ఎంత మంది ఉన్నారు?
570
380
760
950
Answer: 3
760
Question: 18
An article A is produced by five machines whose efficiencies are shown in the following table.
ఐదు యంత్రాలచే ఉత్పత్తి అయిన ఒక వస్తువు A మరియు ఆ యంత్రాల దక్షతలను క్రింది పట్టిక చూపుతుంది
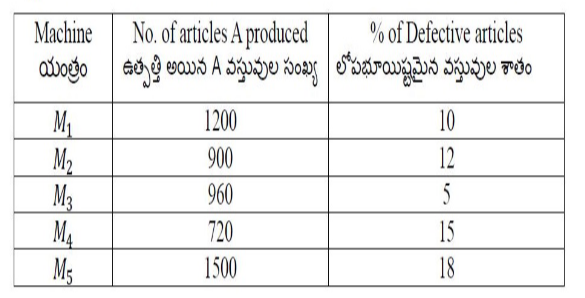
Approximately what percent of total articles produced are defective?
ఉత్పత్తి అయిన మొత్తం వస్తువులలో రమారమి ఎంత శాతం వస్తువులు లోపం కలవి?
10.4
9.4
8.4
12.4
Answer: 4
12.4
Question: 19
An article A is produced by five machines whose efficiencies are shown in the following table.
ఐదు యంత్రాలచే ఉత్పత్తి అయిన ఒక వస్తువు A మరియు ఆ యంత్రాల దక్షతలను క్రింది పట్టిక చూపుతుంది
Ratio of defective articles to the ones non defective is
లోపభూయిష్టమైన వస్తువులకు, లోపభూయిష్టం కాని వస్తువులకు గల నిష్పత్తి
109:771
327:2640
109:773
327:771
Answer: 1
Question: 20
An article A is produced by five machines whose efficiencies are shown in the following table.
ఐదు యంత్రాలచే ఉత్పత్తి అయిన ఒక వస్తువు A మరియు ఆ యంత్రాల దక్షతలను క్రింది పట్టిక చూపుతుంది
Total number of defective articles produced by all the machines is అన్ని యంత్రాలచే ఉత్పత్తి అయిన లోపభూయిష్టమైన వస్తువుల సంఖ్య
652
653
654
655
Answer: 3
654