- Communication Ability-6
- Communication Ability-5
- Communication Ability-4
- Communication Ability-3
- Communication Ability-2
- Communication Ability-1
- Statistical Ability-1
- Algebraic and Geometrical Ability-3
- Algebraic and Geometrical Ability-2
- Algebraic and Geometrical Ability-1
- Date and Time Arrangement Problems-2
- Date and Time Arrangement Problems-1
- Coding and Decoding-2
- Coding and Decoding-1
- Series-2
- Series-1
- Odd Things Out-2
- Odd Things Out-1
- Analogy-2
- Arithmetic Ability-3
- Arithmetic Ability-2
- Data Analysis-2
- Data Sufficiency-3
- Data Sufficiency-2
- Analogy-1
- Arithmetic Ability-1
- Data Analysis-1
- Data Sufficiency-1
Question: 6
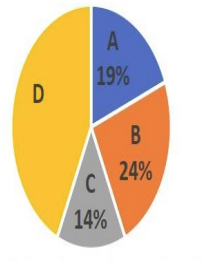
There are 6600 employees in all in four companies A, B, C and D. The following pie chart shows percent wise distribution of the employees in these companies.
A, B, C, D అనే 4 కంపెనీలలో మొత్తం 6600 ఉద్యోగులు ఉన్నారు. ఈ కంపెనీలోని ఉద్యోగుల పంపిణి శాతం లను ఈ క్రింది పీ చిత్రం సూచిస్తుంది.

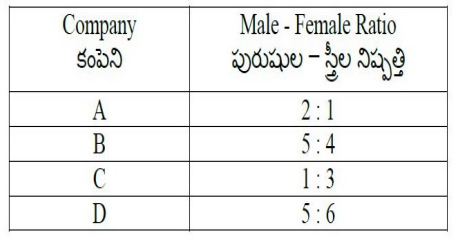
The following table gives the male to female employees ratio in these four companies A, B, C and D.
ఈ నాలుగు కంపెనీలు A, B, C, D లలో పురుషులు మరియు స్త్రీ ఉద్యోగుల నిష్పత్తిని ఈ క్రింది పట్టిక సూచిస్తుంది.

The total number of male employees in companies A and B is
A, B కంపెనీలలో గల మొత్తం పురుష ఉద్యోగుల సంఖ్య
1734
1725
1716
1737
Answer: 3
1716
Question: 7
There are 6600 employees in all in four companies A, B, C and D. The following pie chart shows percent wise distribution of the employees in these companies.
A, B, C, D అనే 4 కంపెనీలలో మొత్తం 6600 ఉద్యోగులు ఉన్నారు. ఈ కంపెనీలోని ఉద్యోగుల పంపిణి శాతం లను ఈ క్రింది పీ చిత్రం సూచిస్తుంది.

The following table gives the male to female employees ratio in these four companies A, B, C and D.
ఈ నాలుగు కంపెనీలు A, B, C, D లలో పురుషులు మరియు స్త్రీ ఉద్యోగుల నిష్పత్తిని ఈ క్రింది పట్టిక సూచిస్తుంది.

The total number of female employees in all these four companies is
ఈ నాలుగు కంపెనీలలో గల మొత్తం స్త్రీ ఉద్యోగుల సంఖ్య
3363
3364
3365
3366
Answer: 1
3363
Question: 8
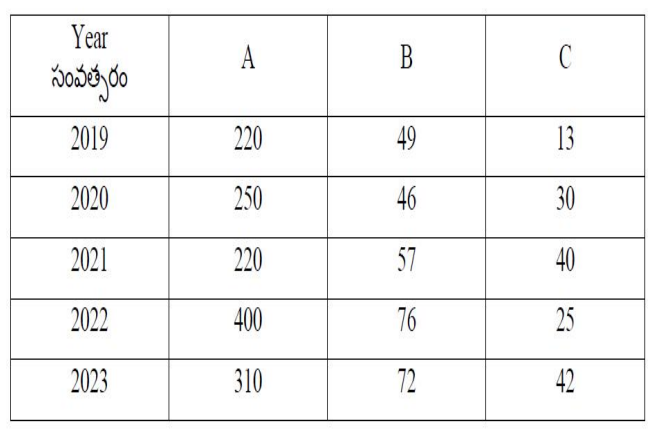
The following table illustrates the number of candidates (in thousands) appeared for three entrance exams A, B, C over a five year period from 2019 to 2023.
2019 నుండి 2023 వరకు గల 5 సంవత్సరాల సమయంలో మూడు ప్రవేశ పరీక్షలు A. B, C లకు హాజరైన అభ్యర్ధుల సంఖ్య (వేలలో)ను ఈ క్రింది పట్టిక వివరిస్తుంది.

By what percent approximately is the maximum number of candidates appeared compared to its previous year in C?
పరీక్ష C కు ఏ సంవత్సరము లోనైతే గత సంవత్సరముతో పోలిస్తే హాజరైన అభ్యర్థుల శాతము గరిష్టంగా ఉందో ఆ శాతం సుమారుగా
125
120
57
131
Answer: 4
131
Question: 9
The following table illustrates the number of candidates (in thousands) appeared for three entrance exams A, B, C over a five year period from 2019 to 2023.
2019 నుండి 2023 వరకు గల 5 సంవత్సరాల సమయంలో మూడు ప్రవేశ పరీక్షలు A. B, C లకు హాజరైన అభ్యర్ధుల సంఖ్య (వేలలో)ను ఈ క్రింది పట్టిక వివరిస్తుంది.

What percent of candidates appeared for B in 2022 compared to all the candidates appeared for B during five years?
ఐదు సంవత్సరాలలో పరీక్ష B కు హాజరైన మొత్తం అభ్యర్ధులతో పోలిస్తే 2022లో పరీక్ష B కు హాజరైన అభ్యర్ధుల శాతమెంత ?
24
25.3
26.3
27
Answer: 2
25.3
Question: 10
The following table illustrates the number of candidates (in thousands) appeared for three entrance exams A, B, C over a five year period from 2019 to 2023.
2019 నుండి 2023 వరకు గల 5 సంవత్సరాల సమయంలో మూడు ప్రవేశ పరీక్షలు A. B, C లకు హాజరైన అభ్యర్ధుల సంఖ్య (వేలలో)ను ఈ క్రింది పట్టిక వివరిస్తుంది.

పరీక్ష A లో 2021తో పోలిస్తే 2022లో హాజరైన అభ్యర్థుల సంఖ్యలో పెరుగుదల శాతం
78
89.2
81.8
72.3
Answer: 3
81.8
